
Netzwerk-Auslastung - NetUtilization
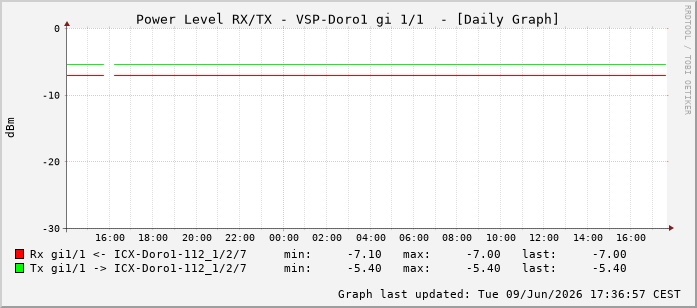
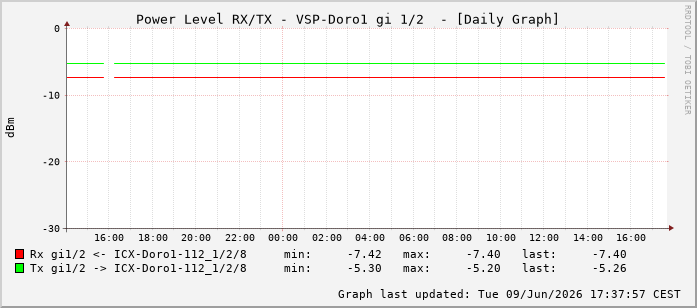
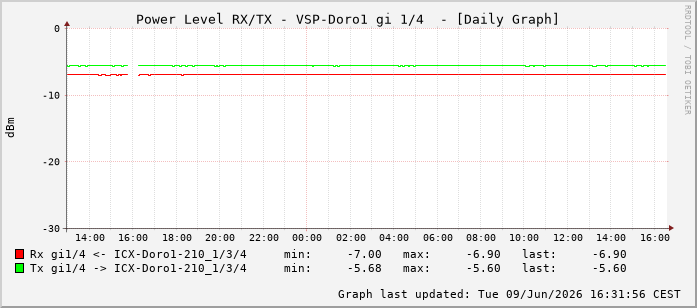
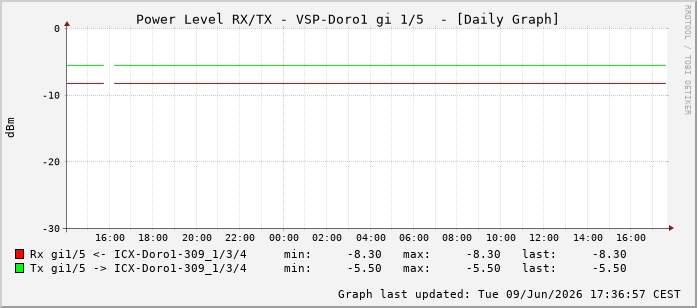
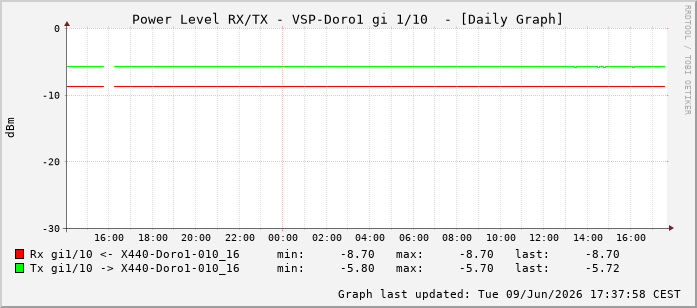
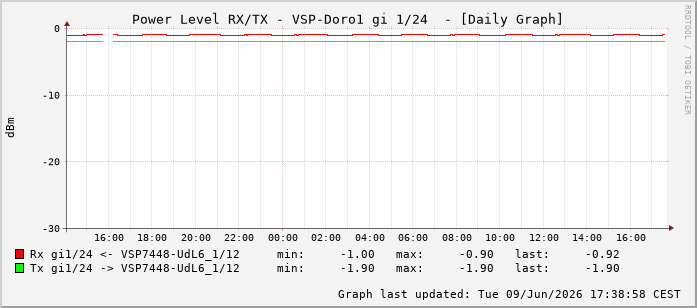
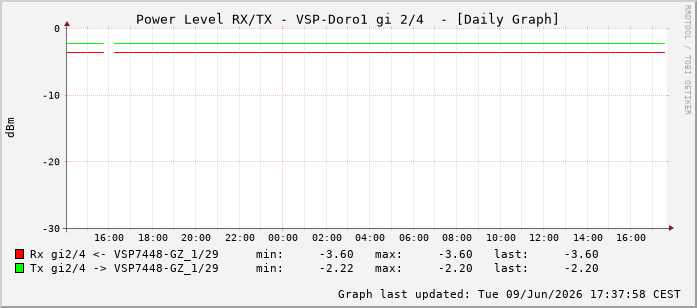
Grafische Darstellung Rx- / Tx- Powerlevel VSP-Doro1
Update: 26.07.2026 03:46:29
Interface gi 1/1
Interface gi 1/2
Interface gi 1/3

Interface gi 1/4
Interface gi 1/5
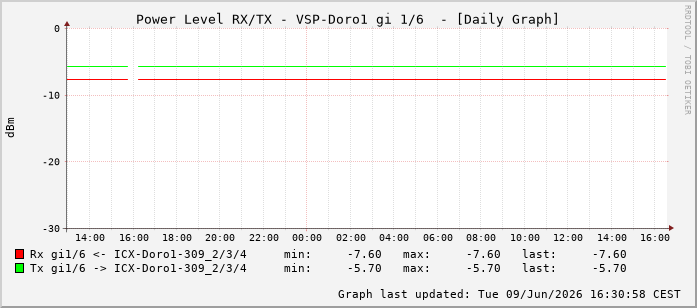
Interface gi 1/6
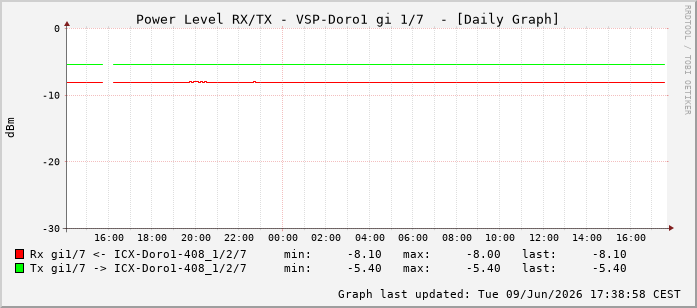
Interface gi 1/7
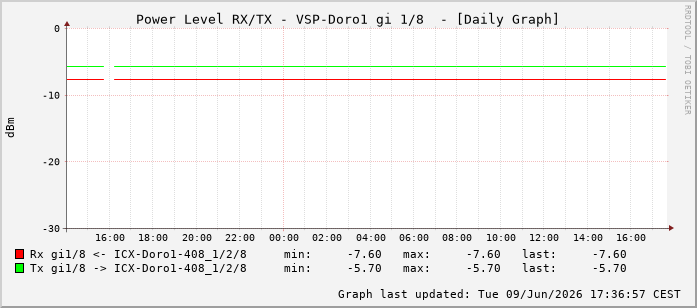
Interface gi 1/8
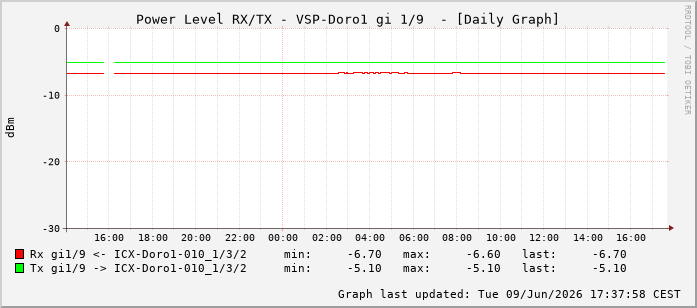
Interface gi 1/9
Interface gi 1/10
Interface gi 1/24
Interface gi 2/4
refresh: 60s
created: 26.07.2026 03:46:29
version 6.o.6 (15.06.2026), 20/10/2011